

So far in 2019, Hollywood has invested more than $700 million in remaking films, banking on audiences to return to movies that have been successful in the past. However, IMA Research studied 27 remakes released since 2014 and found that nearly two-thirds made less money than their original film and nearly all had worse reviews from both critics and audiences. The findings below compare remakes’ publicly available production budgets, box office revenue, critics’ reviews and audience reviews to their original counterpart. It’s important to note we used inflation-adjusted numbers to make a true apples to apples comparison (about our data).
Key Findings:
- Seventeen of 27 (63 percent) remakes were more expensive to make, adjusting for inflation, averaging a $79 million higher price tag. Of the movies with higher production costs, 10 of 17 produced less revenue, again adjusting for inflation.
- Twenty-one of 27 of remakes had lower audience scores, averaging 26 points worse.
- Twenty-two of 27 remakes had lower critics scores, averaging 33 points worse.
- The biggest duds were Poltergeist and Hellboy.
- A few bright spots were The Jungle Book and Pete’s Dragon.
- Only 10 of 27 (37 percent) remakes were more profitable than their original counterpart. On average, remakes produce $146.3 million in profit.
Remakes: The Biggest Losers

At some point Hollywood will learn that not every high-grossing movie needs a remake. Films like 1999’s The Mummy and the original Poltergeist (1982) were great the first time around but not the second. Accounting for inflation, both remakes had higher budgets with The Mummy going over $77 million and Poltergeist $8.7 million. Neither came close to outperforming their originals in the box office – The Mummy made $202 million less, Poltergeist made $203.5 million less. In addition, critics and audiences gave 2017’s The Mummy worse scores than the original, 43 points less for critics and 40 points less for audiences. The same holds true for the 2015 Poltergeist remake – 54 points less for critics and 56 points less for critics.
Adhering to society’s demands for more inclusion didn’t help either. The 2019 remake of What Women Want puts a female twist on a romantic comedy classic by casting a woman for the lead; however, critics score for the remake fell 10 points while audiences’ score fell 21 points. What Men Want made $485 million less at the box office. Fortunately, its budget was only $20 million, $84.3 million less than the original. The 2016 remake for Ghostbusters also casted women for the leading roles, yet 23 percent of critics and 38 percent of audiences think the remake is worse than the original. Its $74.7 million budget increase didn’t help at the box office where it made $452.8 million less than the 1984 original.
Martyrs, originally released in 2008, didn’t do well enough the first time to deserve a remake. It flopped generating only $1.2 million at the box office despite its $7.1 million budget. Even though the remake’s budget shrunk to $1 million, its revenue was less than half of the original’s. The 2015 remake brought in just under $400,000 making it the worse remake in the last five years. Critics and audiences agree as critics’ review score fell 50 points and audiences’ review score fell 54 points.
Disney is seeing relative success compared to other studios
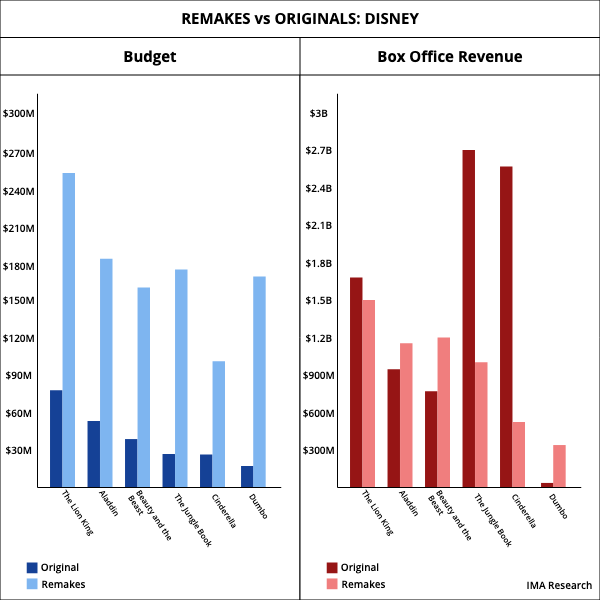
Disney’s Cinderella, The Jungle Book and The Lion King are easily some of the most known movies of all time. The 2015 release for Cinderella produced $2 billion less in revenue, adjusted for inflation, compared to the 1950 version. Critics’ score dropped 12 points and audiences’ score dropped by only two points. The Jungle Book saw a similar loss making $1.7 billion less than the 1967 version even though this is the only Disney remake to receive better reviews than its original. To make matters worse, Disney’s budget for those two remakes was substantially higher than the original films’ budget - $71.5 million more for Cinderella and $148.3 million more for The Jungle Book. The live-action version of The Lion King had the highest budget, $260 million ($182 million more than the original), of Disney remakes for the last five years but couldn’t beat the original’s revenue, generating $164 million less than the 1994 animated version. Audiences like the remake more than critics with audiences’ score falling five points short of the original’s compared to critics whose score fell 40 points.
On the flip side, the remakes to Aladdin, Dumbo and Beauty and the Beast generated more money at the box office than the original films even though they received worse reviews. This year’s Aladdin and Dumbo generated $121.6 million and $325 million more than their original films respectively. That comes at the cost of higher budgets for both films – Aladdin’s budget was $504 million higher while Dumbo’s budget was only $1.6 million more. Critics’ score for this year’s Aladdin is 37 points short of the original score, but audiences scored the remake two points higher than the original. Dumbo’s scores fell 51 points in critics’ reviews and 20 points in audiences’ reviews.
Critics and audiences prefer original films
| Movie Title | Original Release Date | Remake Release Date | Time Difference | Original Production Budget | Original Production Budget (inflation-adjusted) | Remake Production Budget | Difference (Remake minus original) | Original Box Office Revenue | Original Box Office Revenue (inflation-adjusted) | Remake Box Office Revenue | Difference (Remake minus original) | Original Profit | Original Profitable? | Remake Profit | Remake Profitable? | Original Critics Score | Remake Critics Score | Score Difference (Remake minus original) | Original Audience Score | Remake Audience Score | Score Difference (Remake minus original) |
|---|---|---|---|---|---|---|---|---|---|---|---|---|---|---|---|---|---|---|---|---|---|
| RoboCop | 1987 | 2014 | 27 | $13,000,000 | $27,091,267 | $100,000,000 | $72,908,733 | $53,424,681 | $111,334,025 | $242,688,965 | $131,354,940 | $84,242,758 | Yes | $142,688,965 | Yes | 89 | 49 | -40 | 84 | 49 | -35 |
| Annie | 1982 | 2014 | 32 | $50,000,000 | $122,806,735 | $65,000,000 | ($57,806,735) | $57,059,003 | $139,978,446 | $133,821,816 | ($6,156,630) | $17,171,711 | Yes | $68,821,816 | Yes | 56 | 28 | -28 | 69 | 59 | -10 |
| Endless Love | 1981 | 2014 | 33 | $16,000,000 | $41,719,163 | $20,000,000 | ($21,719,163) | $32,492,674 | $84,622,504 | $34,718,173 | ($49,904,331) | $42,903,341 | Yes | $14,718,173 | Yes | 28 | 16 | -12 | 53 | 58 | 5 |
| Godzilla | 1954 | 2014 | 60 | $175,000 | $1,540,104 | $160,000,000 | $158,459,896 | $562,711 | $4,952,191 | $524,976,069 | $520,023,878 | $3,412,087 | Yes | $364,976,069 | Yes | 93 | 76 | -17 | 89 | 66 | -23 |
| Martyrs | 2008 | 2015 | 7 | $6,500,000 | $7,155,545 | $1,000,000 | ($6,155,545) | $1,149,138 | $1,265,032 | $397,072 | ($867,960) | ($5,890,513) | No | ($602,928) | No | 59 | 9 | -50 | 69 | 15 | -54 |
| Hitman: Agent 47 -- Hitman | 2007 | 2015 | 8 | $24,000,000 | $27,434,904 | $35,000,000 | $7,565,096 | $99,965,762 | $114,272,964 | $82,347,656 | ($31,925,308) | $86,838,060 | Yes | $47,347,656 | Yes | 15 | 9 | -6 | 57 | 40 | -17 |
| Point Break | 1991 | 2015 | 24 | $24,000,000 | $42,291,982 | $105,000,000 | $62,708,018 | $83,531,958 | $145,363,392 | $133,718,711 | ($11,644,681) | $103,071,410 | Yes | $28,718,711 | Yes | 69 | 10 | -59 | 79 | 29 | -50 |
| Poltergeist | 1982 | 2015 | 33 | $10,700,000 | $26,280,641 | $35,000,000 | $8,719,359 | $121,700,000 | $298,911,594 | $95,400,000 | ($203,511,594) | $272,630,953 | Yes | $60,400,000 | Yes | 85 | 31 | -54 | 78 | 22 | -56 |
| Cinderella | 1950 | 2015 | 65 | $2,900,000 | $28,520,717 | $100,000,000 | $71,479,283 | $263,591,415 | $2,592,350,473 | $543,500,000 | ($2,048,850,473) | $2,563,829,756 | Yes | $443,500,000 | Yes | 97 | 85 | -12 | 80 | 78 | -2 |
| Ghostbusters | 1984 | 2016 | 32 | $30,000,000 | $69,299,422 | $144,000,000 | $74,700,578 | $295,212,467 | $681,935,116 | $229,147,509 | ($452,787,607) | $612,635,694 | Yes | $85,147,509 | Yes | 97 | 74 | -23 | 88 | 50 | -38 |
| Pete's Dragon | 1977 | 2016 | 39 | $10,000,000 | $39,605,115 | $65,000,000 | $25,394,885 | $39,588,000 | $156,788,731 | $143,700,000 | ($13,088,731) | $117,183,616 | Yes | $78,700,000 | Yes | 52 | 88 | 36 | 60 | 72 | 12 |
| The Jungle Book | 1967 | 2016 | 49 | $4,000,000 | $28,743,353 | $177,000,000 | $148,256,647 | $378,000,000 | $2,716,246,886 | $966,550,600 | ($1,749,696,286) | $2,687,503,533 | Yes | $789,550,600 | Yes | 87 | 94 | 7 | 82 | 86 | 4 |
| The Mummy | 1999 | 2017 | 18 | $80,000,000 | $117,704,681 | $195,000,000 | $77,295,319 | $415,933,406 | $611,966,365 | $409,231,607 | ($202,734,758) | $494,261,684 | Yes | $214,231,607 | Yes | 59 | 16 | -43 | 75 | 35 | -40 |
| Beauty and the Beast | 1991 | 2017 | 26 | $25,000,000 | $39,593,538 | $160,000,000 | $120,406,462 | $424,967,620 | $764,816,909 | $1,263,521,126 | $498,704,217 | $725,223,371 | Yes | $1,103,521,126 | Yes | 94 | 71 | -23 | 92 | 80 | -12 |
| Flatliners | 1990 | 2017 | 27 | $26,000,000 | $48,761,438 | $19,000,000 | ($29,761,438) | $61,489,265 | $115,319,423 | $45,158,254 | ($70,161,169) | $66,557,985 | Yes | $26,158,254 | Yes | 48 | 4 | -44 | 59 | 33 | -26 |
| Murder on the Orient Express | 1974 | 2017 | 43 | $4,500,000 | $22,374,036 | $55,000,000 | $32,625,964 | $27,655,657 | $137,504,150 | $352,789,811 | $215,285,661 | $115,130,114 | Yes | $297,789,811 | Yes | 91 | 60 | -31 | 79 | 54 | -25 |
| Tomb Raider -- Lara Croft: Tomb Raider | 2001 | 2018 | 17 | $115,000,000 | $163,056,385 | $94,000,000 | ($69,056,385) | $274,703,340 | $389,496,814 | $274,650,803 | ($114,846,011) | $226,440,429 | Yes | $180,650,803 | Yes | 20 | 52 | 32 | 47 | 55 | 8 |
| The Grinch -- How the Grinch Stole Christmas! | 2000 | 2018 | 18 | $123,000,000 | $179,362,023 | $75,000,000 | ($104,362,023) | $345,141,403 | $503,294,801.00 | $511,595,957 | $8,301,156 | $323,932,778 | Yes | $436,595,957 | Yes | 51 | 59 | 8 | 56 | 51 | -5 |
| Overboard | 1987 | 2018 | 31 | $22,000,000 | $48,629,844 | $12,000,000 | ($36,629,844) | $26,713,187 | $59,048,096 | $91,244,913 | $32,196,817 | $10,418,252 | Yes | $79,244,913 | Yes | 45 | 24 | -21 | 74 | 55 | -19 |
| A Star is Born | 1976 | 2018 | 42 | $6,000,000 | $26,478,752 | $36,000,000 | $9,521,248 | $80,000,000 | $353,050,029 | $434,888,866 | $81,838,837 | $326,571,277 | Yes | $398,888,866 | Yes | 35 | 31 | -4 | 64 | 22 | -42 |
| Death Wish | 1974 | 2018 | 44 | $3,700,000 | $18,845,746 | $30,000,000 | $11,154,254 | $22,000,000 | $112,055,787 | $49,562,710 | ($62,493,077) | $93,210,041 | Yes | $19,562,710 | Yes | 65 | 18 | -47 | 69 | 72 | 3 |
| Hellboy | 2004 | 2019 | 15 | $66,000,000 | $89,643,652 | $50,000,000 | ($39,643,652) | $99,300,000 | $134,872,950 | $40,786,480 | ($94,086,470) | $45,229,298 | Yes | ($9,213,520) | No | 81 | 17 | -64 | 66 | 53 | -13 |
| What Men Want -- What Women Want | 2000 | 2019 | 19 | $70,000,000 | $104,297,154 | $20,000,000 | ($84,297,154) | $374,111,707 | $557,411,235 | $72,216,294 | ($485,194,941) | $453,114,081 | Yes | $52,216,294 | Yes | 54 | 44 | -10 | 54 | 33 | -21 |
| The Lion King | 1994 | 2019 | 25 | $45,000,000 | $77,906,174 | $260,000,000 | $182,093,826 | $968,483,777 | $1,676,685,905.00 | $1,512,151,476 | ($164,534,429) | $1,598,779,731 | Yes | $1,252,151,476 | Yes | 93 | 53 | -40 | 93 | 88 | -5 |
| Aladdin | 1992 | 2019 | 27 | $28,000,000 | $51,204,476 | $183,000,000 | $131,795,524 | $504,050,219 | $921,772,407 | $1,043,455,515 | $121,683,108 | $870,567,931 | Yes | $860,455,515 | Yes | 94 | 57 | -37 | 92 | 94 | 2 |
| Pet Sematary | 1989 | 2019 | 30 | $11,500,000 | $23,794,891 | $21,000,000 | ($2,794,891) | $57,469,179 | $118,910,683 | $112,399,944 | ($6,510,739) | $95,115,792 | Yes | $91,399,944 | Yes | 52 | 58 | 6 | 59 | 35 | -24 |
| Dumbo | 1941 | 2019 | 78 | $950,000 | $16,581,119 | $170,000,000 | $153,418,881 | $1,600,000 | $27,926,095 | $353,030,225 | $325,104,130 | $11,344,976 | Yes | $183,030,225 | Yes | 98 | 47 | -51 | 70 | 50 | -20 |
Over the last five years, Hollywood’s investments in remakes fluctuate, but collectively they’ve increased 60 percent. Unfortunately, 67 percent of remakes came up short at the box office compared to their original films. Audiences and critics felt 77 percent of remakes were not better than their original film. According to audiences, Poltergiest (2015) was the worst remake of the last five years. Critics’ reviews score this year’s Hellboy as the worst. The only remakes critics and audiences agreed were better than their originals are Tomb Raider (2018), Pete’s Dragon (2016) and The Jungle Book (2016).
About our Data
We used an inflation calculator to calculate updated budgets and box office revenues for original films. Release dates, budgets and box office revenues were gathered from IMDb, Box Office Mojo and The Numbers. Critics’ and audience scores came from Rotten Tomatoes.