Though they’ve been conducted every 10 years since 1790, the process of a national census has rarely been without controversy. Throughout the history of the U.S. census, the decennial count has been used as a political tool by advocates on all sides, and the most recent is no exception.
Two years before surveys began, the 2020 census was the subject of controversy over a question over citizenship that typically has not been included in most forms mailed to households. And in early 2020 came the coronavirus pandemic, further complicating the legally mandated counting of all individuals who live in this country.
What do you need to know about the census and its history, and what changes can we expect based on the final tally?
Table of Contents:
Census History & Purpose

A population count is mandated in the constitution, though that document leaves most details up to lawmakers. The first-ever U.S. census began Aug. 2, 1790, and households were asked a total of six questions. By the time all the counting was done, the population of the United States that year was just under four million.
Ensuring an accurate count is important because of the slew of areas impacted by population. Distribution of funding for many federal programs, accounting for as much as a trillion dollars in spending, is based on the census, and determining the number of members of the U.S. House of Representatives each state will have depends on census figures as well.
2020 Question Controversy
The previously mentioned citizenship question would have read: “Is this person a citizen of the United States?” Since 1950, most forms have not included this question, and the Trump administration had planned to revive the question for the 2020 census.
Since 2000, the U.S. Census Bureau has conducted annual surveys of a smaller percentage of households, and the bureau uses that information for a variety of publications between full census periods. The American Community Survey, which is conducted in every county and surveys about one in 38 households, does include that question. However, the decennial census has never sought that information directly for every person in each household in the country, though some long-form questionnaires in the past did include it.
The battle over inclusion of the question was driven largely by fears among many groups, including Democratic politicians, that fewer people would respond to the census out of fear for their family members whose immigration status may be in question. Those fears would largely have impacted Hispanic or Latino households, which are among the demographic groups who normally have lower return rates for census questionnaires than white households.
When all was said and done and the forms went out, the citizenship question did not appear.
Pandemic Problems
Beginning March 12, 2020, American households started receiving their census forms, and a website was launched allowing them to submit their responses. But the forms went out amid widespread confusion over the growing coronavirus pandemic, and just three days later, the federal Centers for Disease Control and Prevention (CDC) began recommending various measures to limit the spread of the virus. By the end of March, the U.S. had the highest number of cases in the world, and by early April, nearly 10 million Americans had lost their jobs, as businesses all over the country closed or laid off workers in response to COVID-19 prevention measures.
In response, the U.S. Census Bureau expanded the self-reporting period, which had been originally scheduled to run between March 12 and July 31, to Oct. 15. Built into all full census efforts is a period called nonresponse follow-up in which census workers personally visit households that haven’t responded to the census. This period began in July 2020 (it was originally scheduled to start in May), and the bureau said it had finished that process by October. There’s much reason to believe that the shortened follow-up period and the pandemic may lead to inaccurate counts. A Pew Research Center survey conducted in the summer of 2020 showed that 40 percent of people who hadn’t yet responded to the census said they wouldn’t answer the door if a census worker came knocking.

Data Irregularities & Delayed Reporting
By law, the deadline for submitting census apportionment data (which is used to determine the number of House representatives each state receives) is the end of the first week of the start of Congress in the year after the decennial count. In other words, the deadline was Jan. 10, 2021. That information currently is not expected until February or March.
In the fall of 2020, the bureau warned lawmakers that it had encountered statistical anomalies that would likely keep calculations from being completed by the deadline. While the agency did not specify what those anomalies were or why they occurred, there are some indications that a combination of the pandemic, bad weather like wildfires and hurricanes, and administrative changes to the census could be to blame.
In addition to the pandemic and weather issues, a major change in the use of census workers called enumerators may have led to delays as well as statistical concerns. The 2020 census used some data from other federal agencies like the IRS and Medicare to fill in gaps left by households that didn’t respond to the survey.

Previously, it had been policy to have enumerators make up to six visits per household to receive census responses; after they’d exhausted a reasonable number of in-person visits, they’d rely on data from other agencies. But this time around, according to whistleblowers within the agency, administrative records came into play too early in thousands of cases. The increased use of administrative records modeling was expected to reduce the workload of enumerators by as much as 10 percent, lowering the total cost of conducting the census.
The whistleblowers’ claims indicate that these shortcuts in data collection could have resulted in the anomalies the agency reported, as well as potentially leading to an inaccurate count. A lack of transparency to this point also is raising questions. According to an announcement from the bureau in October 2020, 99.98 percent of all households had been accounted for, but the bureau has yet to publish detailed assessments of the accuracy of the count.
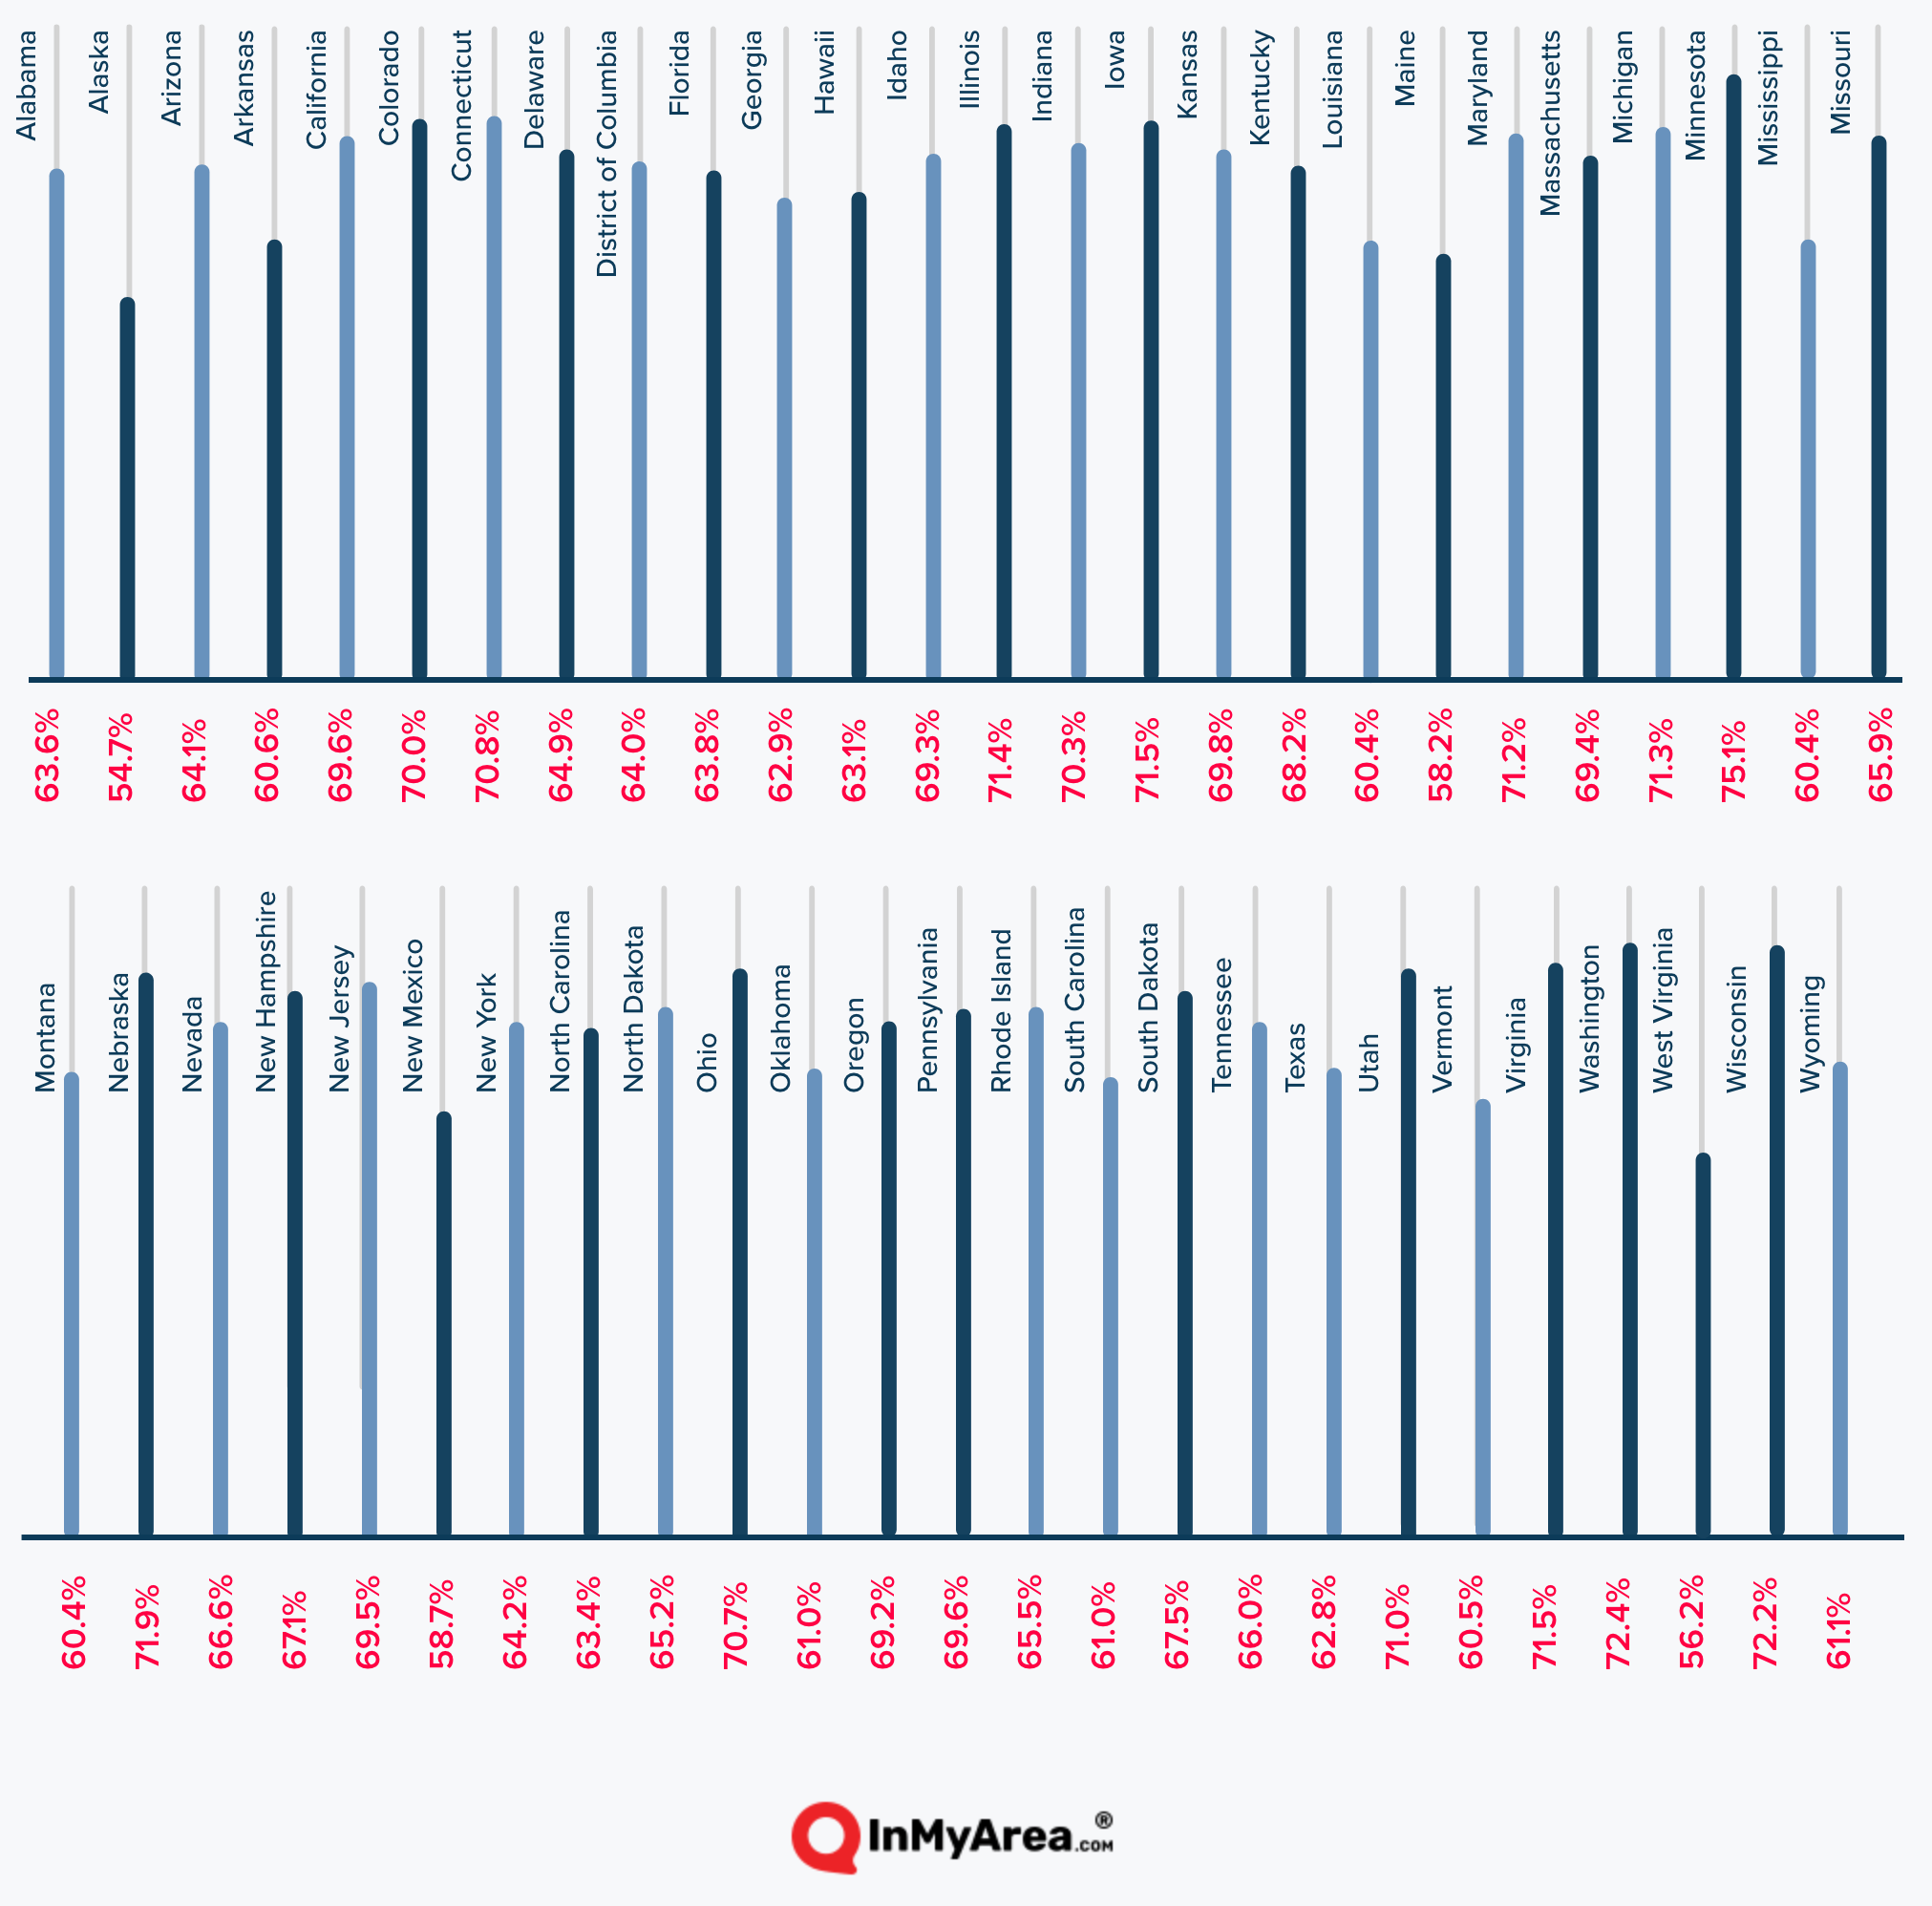
In some states, this may be a bigger issue than in others. Overall, more than two-thirds of census surveys were reported through the self-reporting tool, meaning no enumerators were necessary to receive results for about 67 percent of all households. This represents a slight increase from the rate in 2010, but residents of many states had far lower self-reporting rates.
Perhaps not surprisingly given its frigid terrain, Alaska’s self-reporting rate was lowest at about 55 percent, while Minnesota’s rate of just over 75 percent was the highest self-reporting rate, according to Census Bureau data.
Percentage of households self-reporting 2020 census information by state

Preview of 2020 Census: Population Growth Stagnating
While it’s true that the bevy of detailed data that typically comes with a decennial census isn’t available yet because of the issues we’ve explored, the Census Bureau has released some data that can provide a preview of what’s to come. In July 2020, the bureau released its annual population estimates, which aren’t based on the census forms people filled out in 2020 but may give us a window into how the U.S. population has changed over the past decade.
That data indicates that expansion of the U.S. population in the 2010s has been the slowest since 1900 and may be the slowest rate since census data collection began. The most recent estimates show that since 2010, the U.S. has added nearly 21 million new residents, which equates to a growth rate of just under seven percent.
If indeed that is what the 2020 census indicates, it would represent the lowest decennial growth rate on record, according to an analysis of historic census data from the Brookings Institution. The previous low was just under 10 percent, recorded between 2000 and 2010, and it’s a far cry from the decennial growth rate record of 36 percent in 1800-1819, not long after the census began.
Not only is the 10-year growth rate on pace to be the lowest ever recorded, the annual rate of population growth looks to be a record low, too. Annual population growth rates have declined for most of the past 10 years, and the past year’s growth rate of about one-third of a percentage point would be the lowest since at least 1900.
However, some states are bucking these trends. In fact, 14 states should post double-digit growth rates if the estimates for 2020 are correct, while six states look to have recorded a decline over the past decade.
D.C. and Utah have had the fastest rates of population growth since 2010, according to the census estimates, while West Virginia and Illinois have each seen their populations shrink over the past 10 years.

Estimated population change, 2010-2020, by state
| State | Estimated Population Change | Rank (Growth) |
|---|---|---|
| Alabama | 2.8% | 33 |
| Alaska | 2.4% | 36 |
| Arizona | 15.8% | 6 |
| Arkansas | 3.7% | 29 |
| California | 5.5% | 23 |
| Colorado | 15.1% | 8 |
| Connecticut | -0.6% | 49 |
| Delaware | 9.7% | 15 |
| District of Columbia | 17.8% | 1 |
| Florida | 15.3% | 7 |
| Georgia | 10.3% | 14 |
| Hawaii | 3.2% | 31 |
| Idaho | 16.3% | 4 |
| Illinois | -2.0% | 50 |
| Indiana | 4.1% | 26 |
| Iowa | 3.7% | 28 |
| Kansas | 1.9% | 39 |
| Kentucky | 3.0% | 32 |
| Louisiana | 2.2% | 37 |
| Maine | 1.7% | 40 |
| Maryland | 4.6% | 25 |
| Massachusetts | 5.0% | 24 |
| Michigan | 0.9% | 43 |
| Minnesota | 6.5% | 20 |
| Mississippi | -0.1% | 46 |
| Missouri | 2.6% | 34 |
| State | Estimated Population Change | Rank (Growth) |
|---|---|---|
| Montana | 9.1% | 17 |
| Nebraska | 5.9% | 22 |
| Nevada | 16.1% | 5 |
| New Hampshire | 3.8% | 27 |
| New Jersey | 0.9% | 42 |
| New Mexico | 2.0% | 38 |
| New York | -0.3% | 47 |
| North Carolina | 10.7% | 12 |
| North Dakota | 13.4% | 10 |
| Ohio | 1.3% | 41 |
| Oklahoma | 5.9% | 21 |
| Oregon | 10.5% | 13 |
| Pennsylvania | 0.6% | 44 |
| Rhode Island | 0.3% | 45 |
| South Carolina | 12.6% | 11 |
| South Dakota | 9.4% | 16 |
| Tennessee | 8.4% | 18 |
| Texas | 16.3% | 3 |
| Utah | 17.1% | 2 |
| Vermont | -0.4% | 48 |
| Virginia | 7.1% | 19 |
| Washington | 14.1% | 9 |
| West Virginia | -3.7% | 51 |
| Wisconsin | 2.5% | 35 |
| Wyoming | 3.2% | 30 |


