
- The Infrastructure Investment and Jobs Act (IIJA) is landmark legislation, a victory long sought by both parties to meaningfully invest in the condition of America’s roads, bridges, water systems, public transportation, and other key infrastructure.
- The $450 billion infrastructure portion of the bill allocates $26.2 billion to strengthen America’s bridges. However, $33.5 billion is needed to fix every bridge in poor condition.
- Some states’ allotments will go farther than others. Utah, Nevada, and North Dakota will each receive at least $158 million more than they need to repair their deficient bridges.
- New York will receive more than $1 billion for bridge improvement, but that would only cover about 60 percent of the costs needed to strengthen the state’s bridges in poor condition.
- Approximately one in five bridges in West Virginia, Iowa, and Rhode Island are in poor condition, but none of these states will receive enough funding from the IIJA to strengthen the bridges that need repair most.
The IIJA is a Big Win for President Biden, but is it Enough for America’s Bridges?
“If I visited your town,” Joe Biden said at the signing of the IIJA, “I’m sure you’d be able to tell me where you hold your breath as you cross that particular bridge…This law makes this the most significant investment in roads and bridges in the past 70 years.”
The president’s remarks speak to the chronic underinvestment in infrastructure that has plagued the country for decades. The bipartisan law is undoubtedly a win for President Biden and a country in serious need of an infrastructure revamp. It’s worth asking whether the IIJA puts those breathless bridge-crossings behind us.
According to data from the National Bridge Inventory (NBI) this legislation alone will not be enough. The NBI report, compiled by the U.S. Department of Transportation and the Federal Highway Administration, serves as a record of the conditions of thousands of bridges on federal highways and other roads. The data tells a story of the unequal need for bridge repair across the states.
Let’s break down the difference between funds and financial need, which states are hit the hardest, and what factors are driving the shortfalls.
A Much Needed Band-Aid for Bridges
The IIJA throws a lot of money at roadway repairs and sets aside a hefty sum for bridges specifically.
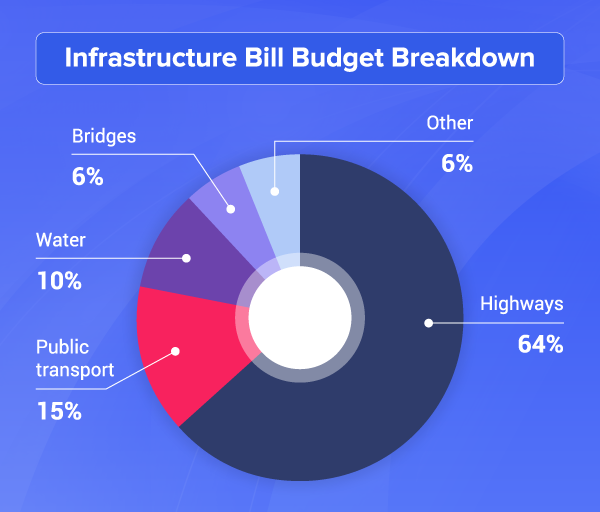
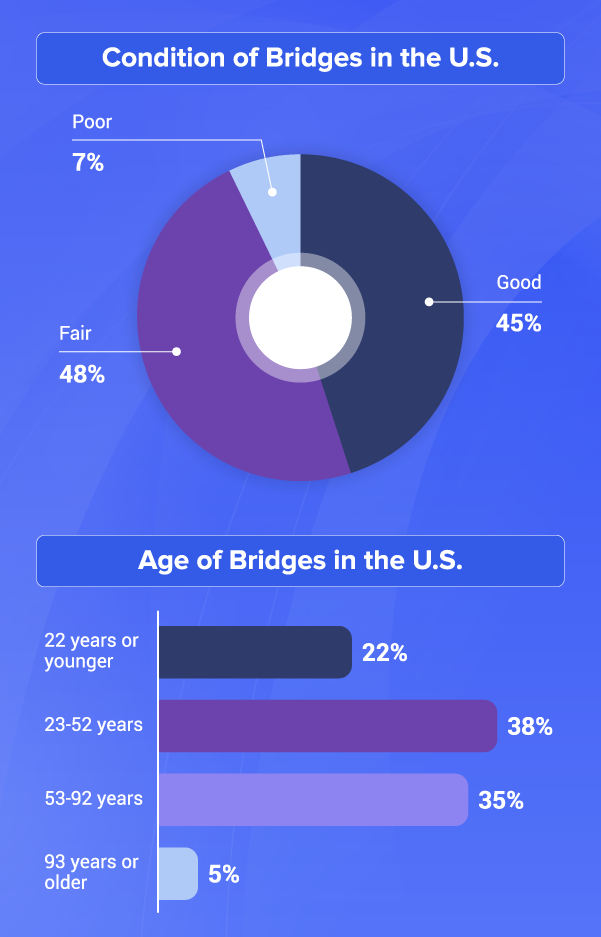
Bridge funding makes up just six percent of infrastructure funding in the bill but still totals over $26 billion. Each dollar is badly needed. Forty-four thousand bridges, or about seven percent of the U.S. total, are in poor condition, meaning one or more parts of the bridge are in need of repair. Fortunately, that’s an improvement from a decade ago when the figure was closer to 12 percent.
Source: 2020, 2022 National Bridge Inventory, National Highway System, U.S. Department of Transportation
Structurally deficient bridges are a significant safety issue for American travelers. Since 2000, dozens of people have died in bridge collapses. Some of the most notorious events include the collapse of the Queen Isabella Causeway and the I-40 Bridge disasterin Oklahoma.
The federal government mandates periodic bridge inspections and traffic restrictions on bridges in dangerous conditions to prevent such tragedies. In 2019, 10 percent of the country’s bridges were required to restrict or limit traffic due to structural deficiencies, according to the American Society of Civil Engineers. Today, new bridges feature innovative technologies to increase safety and service life, and regulation now requires bridges to be built with at least a 75-year expected lifespan.
For this reason, as well as the additional wear of years of use, older bridges are more likely to be in poor condition. There are plenty of old and deficient bridges in the country: 42 percent are more than 50 years old, and 12 percent of our nation’s bridges were built before 1941.
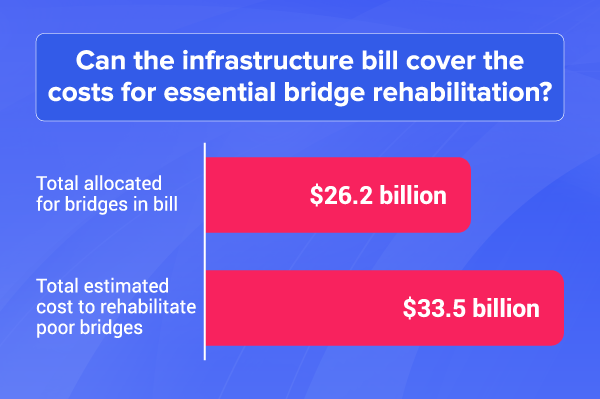
According to the National Bridge Inventory, the total cost of the most essential bridge repairs is $33.5 billion, which is $7.3 billion more than the amount allotted by the IIJA. However, since the infrastructure bill was passed, the money set aside for infrastructure improvements has lost purchasing power due to rapid inflation.
Assuming an eight percent rise in the total cost since 2021 estimates were made, the cost of repairing all bridges has risen to over $36 billion. This makes the shortfall between the cost of needed repairs and the allocation for bridge improvements closer to $10 billion today.
Regardless, the infrastructure package is a great start. For some states, it’s more than enough to tackle their broken bridges. For others, it’s woefully insufficient.
Which States Have the Worst Bridges in the Country?
As you can see in the map below, there’s a regional factor to bridge quality. Bridges in the western part of the country are faring much better than those in New England and the Rust Belt. Western states are also the most likely to enjoy a surplus. This relates to the main factors driving the total cost of bridge repair: age, use, and state population density.
| States with the highest percentage of poor bridges | States with the lowest percentage or poor bridges | ||
|---|---|---|---|
| West Virginia | 21% | Nevada | 1% |
| Iowa | 19% | Texas | 1% |
| Rhode Island | 19% | Arizona | 2% |
| South Dakota | 18% | Utah | 2% |
| Pennsylvania | 15% | Delaware | 2% |
Bridges in the Northeast are a bit older on average, partially due to having industrialized earlier than other parts of the country. They also experience heavy use, since they are often in cities with some of the highest population densities in the country. As a result, Northeastern and Midwestern states tended to have higher percentages of bridges in poor condition.
When it comes to the states with the worst bridges in the country, underinvestment at the state level can be a major factor. States with shrinking tax bases, underfunded social programs, and chronic underinvestment in infrastructure predictably suffered from poor bridge quality. West Virginia, a state which tends toward the bottom of many state rankings such as public health, education, and general infrastructure, had the highest percentage of poor bridges.
On the other hand, the western region has the opposite qualities in its favor. Aside from a few populous states like California, other states in the region such as Montana, Wyoming, and Alaska have big land areas, low populations, and relatively modest use of their roads. Nevada, the state with the lowest percentage of bridges in poor condition, fits this description as well.
Bridge Allocations: Funding Doesn’t Always Match the Need
States with large areas and relatively low population densities tend to fare the best in terms of receiving the money needed to meet their bridge needs, and even having money left over from the bill’s allocations. Those states also have, on average, younger bridges. Of the seventeen states expected to have money left over, twelve are ranked in the bottom half of the U.S. in terms of population density.
| States receiving far MORE for bridge rehab than what is needed | States receiving far LESS for bridge rehab than what is needed | ||
|---|---|---|---|
| Utah | +$199 million | New York | -$1.3 billion |
| Nevada | +$189 million | Pennsylvania | -$888 million |
| North Dakota | +$158 million | Illinois | -$838 million |
| Vermont | +$140 million | Massachusetts | -$725 million |
| Delaware | +$129 million | New Jersey | -$624 million |
States like Illinois, Pennsylvania, and New York have huge shortfalls partially because of their large populations and daily heavy traffic on their roadways.
One standout state in terms of infrastructure need is New York, which received the most funds from the bill and is still over a billion dollars short. According to the New York State Comptroller, part of New York’s huge shortfall is due to the state’s longstanding budget challenges. Roughly 80 percent of the state’s highway and bridge funds are “siphoned off” to service debts and patch up holes in other state programs.
Why are there such huge disparities between some states’ needs and allocations? Most of the funding was based on congressional formulas that have long been used to dole out federal funds, for programs ranging from infrastructure to education. The bridge formula factors in things like vehicle miles traveled per year, population, investment need, and the total area of the state.
Although it tries to allocate funds objectively and consistently, the formula isn’t perfect. Much of the disparity between federal funding and real need can be traced back to it. States like Alaska and Arizona won big thanks to their large land area, despite not having much need for repair funds.
Bridging the Gap
No matter how you slice it, there simply isn’t enough money allocated to bridges to meet the country’s needs. The question becomes how to fix that.
When it comes to bringing all bridges up to standard, the IIJA certainly makes the required funds a much less daunting figure. The extra money will either come from a future federal package, or the states will need to raise the money on their own. No driver loves gas taxes or toll roads, but they’re an effective way to keep infrastructure funds flowing without politically difficult, one-off spending sprees.
As is the case for New York, a common problem is that states dip into infrastructure funds to top up other underfunded programs. To avoid the problem in the future, both states and the federal government should pursue a system that regularly funds infrastructure maintenance projects, and restricts infrastructure money from being used on other underfunded programs.
Infrastructure Bill: A Great Start for Bridge Funding
Though some states ended up with more than they need, the bridge repair allocation in the IIFA isn’t enough to fix the country’s aging bridges. States will have to prioritize the bridges with the most urgent needs and come up with the money to pay for the rest.
The extent of the shortfall varies greatly from state to state, but generally, states with high population densities and older bridges fared the worst. The Northeast fits that description, and predictably has some of the worst budget gaps. The Western states are doing the best, largely because of their low population densities and newer bridges.
There is one silver lining, though: states that need more money for bridge repair also tend to have more drivers using their roads, and thus a bigger tax base to draw from. Toll roads and gas taxes, while at times difficult to execute politically, could help these states get all bridges up to snuff.
Our Data
For this report, we compiled funding allocation information from White House fact sheets on the Infrastructure Investment and Jobs Act. These fact sheets detail the projected amounts each state will receive for infrastructure and job improvements.
We compared the funding amounts to the estimated costs required to rehabilitate bridges in poor condition in each state. These data were published in the National Bridge Inventory, compiled by the U.S. Department of Transportation and the Federal Highway Administration.
Bridge condition data was also provided by the National Bridge Inventory.