

Key Findings:
- Seven U.S. metros are underbuilt relative to their population growth between 2021 and 2024, including Miami, Lansing, Reading, and Bridgeport. For four of them, even 2025 permitting activity was not enough to close the gap.
- Miami-Fort Lauderdale-West Palm Beach is the most acutely underserved large metro area, with more than half of its population growth since 2021 still outpacing new housing supply.
- The coastal metro areas of North Port-Bradenton-Sarasota, FL; Wilmington, NC; and Myrtle Beach-Conway, SC permitted the most residential units per 1,000 residents in 2025.
- Houston and Dallas-Fort Worth each issued permits for more than 65,000 total housing units in 2025, leading the nation in raw construction volume.
- In Spartanburg, SC, Stockton-Lodi, CA, and Lafayette, LA, nearly all new planned housing will be single-unit residences.
- Connecticut's Bridgeport-Stamford-Danbury and New Haven metros have the highest concentration of multi-unit permits in the country.
America has a housing shortage, but it doesn't look the same in every city. Recent construction data shows a more uneven reality. In many U.S. metros, housing production has kept pace with population growth in recent years, at least on paper. But in many fast-growing markets, construction still isn't keeping pace with the number of new residents, creating localized gaps between housing supply and demand.
Residential building permits offer one of the clearest early indicators of where new housing is likely to emerge. By analyzing construction permit data from the U.S. Census Bureau's Building Permits Survey across the 150 largest U.S. metropolitan areas, InMyArea.com examined where construction is accelerating, where it is slowing, and how it compares to population growth.
The result is a housing market that is both active and uneven. Sun Belt metros (particularly in Florida, the Carolinas, and parts of the Mountain West) are building at some of the fastest rates in the country. The most striking finding isn't where building is happening, it's where it isn't keeping up.
Which Cities Have the Most Critical Housing Shortages?
Year-over-year permit trends show how construction is changing. But they don't fully answer the most important question: are cities building enough housing for the people who are actually moving there?
To answer that, we compared total housing permits issued from 2021 through 2024 against population growth over the same period, estimating how many new residents those permits could realistically house. We then evaluated whether 2025 permitting activity could begin to close any remaining gap.
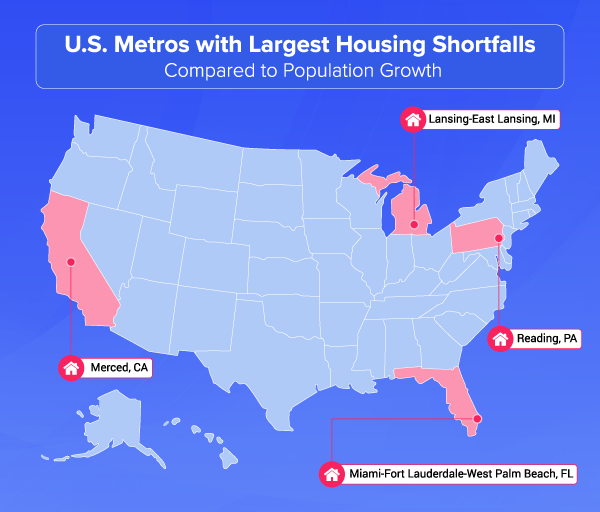
The results show that in many metros, housing construction plans are simply not keeping pace with population growth. Seven metros underbuilt relative to their population growth between 2021 and 2024:
- Lansing-East Lansing, MI
- Reading, PA
- Miami-Fort Lauderdale-West Palm Beach, FL
- Merced, CA
- Anchorage, AK
- Hartford-West Hartford-East Hartford, CT
- Bridgeport-Stamford-Danbury, CT
For most of those metros, 2025 permitting activity helped close the gap. But for four of them in the table below, it wasn't enough.
Metro | Population growth not matched by new housing | Percent of new population not matched by new housing in 2025 |
|---|---|---|
Merced, CA | 358 | 12% |
Miami-Fort Lauderdale-West Palm Beach, FL | 66,553 | 53% |
Reading, PA | 4,076 | 80% |
Lansing-East Lansing, MI | 9,203 | 82% |
Source: U.S. Census Bureau Building Permits Survey (BPS), 2021–2025; U.S. Census Bureau Population Estimates, 2021–2024
The metros with the largest housing shortfalls are no longer defined just by permits or population growth in isolation, but by the gap between the two, measured in real people. Miami stands out at scale. Even with strong multifamily construction, more than half of the region's population growth since 2021 remains unserved by new housing supply, even after 2025 permits are accounted for. Reading and Lansing present a different kind of challenge: smaller metros where modest population growth has nonetheless outstripped a construction market that simply hasn't responded.
The result is a persistent, cumulative housing shortage, in which unmet demand carries forward year after year, increasing pressure on prices, rents, and availability.
With that context in mind, it's worth examining where the most construction activity is actually happening — and whether the metros building the most are doing enough to close the gap.
Which U.S. Cities Are Building New Homes the Fastest in 2025?
Houston and Dallas-Fort Worth sit atop the volume rankings with more than 65,000 new residential housing units permitted, a scale that no other metro comes close to matching. Together, the two Texas metros account for a substantial share of all new residential construction nationwide. But the year-over-year column tells a more complicated story: Dallas is down nine percent, Atlanta is down 18 percent, and Austin and New York are down 17 percent. Of the top 10, only Orlando, Tampa, and Los Angeles posted gains in 2025.
Top 20 U.S. Metro Areas by Total New Residential Units Permitted, 2024 vs. 2025
Rank | Metro | Units permitted 2025 | Units permitted 2024 | YOY change |
|---|---|---|---|---|
1 | Houston-Pasadena-The Woodlands, TX | 65,200 | 65,747 | -1% |
2 | Dallas-Fort Worth-Arlington, TX | 65,181 | 71,788 | -9% |
3 | New York-Newark-Jersey City, NY-NJ | 47,828 | 57,929 | -17% |
4 | Phoenix-Mesa-Chandler, AZ | 39,145 | 45,884 | -15% |
5 | Atlanta-Sandy Springs-Roswell, GA | 33,401 | 40687 | -18% |
6 | Orlando-Kissimmee-Sanford, FL | 27,758 | 24,135 | +15% |
7 | Los Angeles-Long Beach-Anaheim, CA | 27,700 | 26,781 | +3% |
8 | Austin-Round Rock-San Marcos, TX | 26,964 | 32,294 | -17% |
9 | Tampa-St. Petersburg-Clearwater, FL | 22,819 | 20,950 | +9% |
10 | Charlotte-Concord-Gastonia, NC-SC | 22,168 | 25,935 | -15% |
11 | Miami-Fort Lauderdale-West Palm Beach, FL | 21,381 | 16,352 | +31% |
12 | Nashville-Davidson-Murfreesboro-Franklin, TN | 19,210 | 20,038 | -4% |
13 | Washington-Arlington-Alexandria, DC-VA-MD-WV | 18,073 | 21,487 | -16% |
14 | North Port-Bradenton-Sarasota, FL | 17,639 | 14,938 | +18% |
15 | Raleigh-Cary, NC | 17,480 | 18,979 | -8% |
16 | Denver-Aurora-Centennial, CO | 16,049 | 15,570 | +3% |
17 | Chicago-Naperville-Elgin, IL-IN | 15,874 | 18,064 | -12% |
18 | Columbus, OH | 15,847 | 13,962 | +14% |
19 | Riverside-San Bernardino-Ontario, CA | 15,817 | 15,824 | 0% |
20 | Seattle-Tacoma-Bellevue, WA | 15,639 | 17,920 | -13% |
Source: U.S. Census Bureau Building Permits Survey (BPS), 2024–2025
The divergence within this table captures the broader split in the national market. Florida metros are still accelerating. Most other large construction markets are pulling back, digesting the surge years of 2021 and 2022 amid elevated construction costs and sustained mortgage rates above six percent.
Permitting activity in 2025 was uneven. Some high-cost metros saw sharp rebounds, including San Jose (+47 percent in new units) and San Francisco (+32 percent in new units), while several Sun Belt markets cooled after the peak of pandemic-era construction. These swings highlight how volatile housing supply can be year to year, even as longer-term supply gaps persist.
Raw permit volume tells you where actual construction activity is concentrated. But per-capita rates tell you where building is most intense relative to population and reveal a different set of leaders entirely.
The list below reads like a map of America's domestic migration patterns over the last decade. Every metro in the top 10 sits in the Southeast, South, or Mountain West, and Florida alone claims four of the top 10 spots and six of the top 20. North Port-Bradenton-Sarasota's rate of 18.9 housing units permitted per 1,000 residents isn't just the national leader; it's roughly double the rate of most metros in the bottom half of the rankings.
U.S. Metro Areas with Most Residential Housing Units Permitted per 1,000 Residents, 2025
Rank | Metro | Housing units permitted per 1,000 residents | Change in units, 2024-2025 |
|---|---|---|---|
1 | North Port-Bradenton-Sarasota, FL | 18.9 | +18% |
2 | Wilmington, NC | 15.9 | -21% |
3 | Myrtle Beach-Conway-North Myrtle Beach, SC | 15.8 | -11% |
4 | Cape Coral-Fort Myers, FL | 15.7 | -12% |
5 | Fayetteville-Springdale-Rogers, AR | 14.8 | +12% |
6 | Ocala, FL | 14.0 | -11% |
7 | Savannah, GA | 12.4 | +32% |
8 | Raleigh-Cary, NC | 11.2 | -8% |
9 | Crestview-Fort Walton Beach-Destin, FL | 11.1 | -17% |
10 | Boise City, ID | 11.1 | +4% |
11 | Austin-Round Rock-San Marcos, TX | 10.6 | -17% |
12 | Spartanburg, SC | 10.3 | +26% |
13 | Durham-Chapel Hill, NC | 10.0 | +60% |
14 | Madison, WI | 9.9 | +20% |
15 | Provo-Orem-Lehi, UT | 9.7 | +14% |
16 | Lakeland-Winter Haven, FL | 9.5 | -22% |
17 | Orlando-Kissimmee-Sanford, FL | 9.4 | +15% |
18 | Nashville-Davidson-Murfreesboro-Franklin, TN | 8.9 | -4% |
19 | Port St. Lucie, FL | 8.7 | -12% |
20 | Greenville-Anderson-Greer, SC | 8.6 | -4% |
Source: U.S. Census Bureau Building Permits Survey (BPS), 2025; U.S. Census Bureau Population Estimates, 2024
These are markets where land is still relatively available, zoning is comparatively permissive, and demand driven by in-migration has created sustained builder confidence. The presence of Fayetteville, AR and Savannah, GA alongside coastal Florida metros signals that the construction boom has spread beyond the obvious retirement and beach destinations into inland workforce communities. Boise's continued presence in the top 10 suggests that demand in the Mountain West has yet to soften materially. Further down the list, the appearance of Madison, WI and Durham-Chapel Hill, NC (alongside the Sun Belt regulars) hints that the fastest-building tier is slowly diversifying beyond its traditional geography.
Beyond where homes are being built, the specific types of housing permits issued reveal another dimension of how different cities are responding to demand.
Are U.S. Cities Building More Single-Family Homes or Multifamily Units?
Looking at permit volume only tells part of the story. The type of housing being built (and where) matters just as much. A surge in high-rise apartment construction will do little to help a couple looking for a single-family home with a yard if such houses are hard to come by
Top 10 U.S. Metro Areas by Share of Residential Permits for Multi-Unit Buildings (5+ Units), 2025
Rank | Metro | Share of 2025 permits for multi-unit housing |
|---|---|---|
1 | Bridgeport-Stamford-Danbury, CT | 84% |
2 | New Haven, CT | 83% |
3 | Boulder, CO | 79% |
4 | Madison, WI | 76% |
5 | New York-Newark-Jersey City, NY-NJ | 75% |
6 | Miami-Fort Lauderdale-West Palm Beach, FL | 75% |
7 | Oxnard-Thousand Oaks-Ventura, CA | 71% |
8 | San Diego-Chula Vista-Carlsbad, CA | 70% |
9 | Syracuse, NY | 69% |
10 | Santa Maria-Santa Barbara, CA | 69% |
Source: U.S. Census Bureau Building Permits Survey (BPS), 2025
The permit data reveal two fundamentally different answers to the question of how America is addressing its housing shortage. In land-constrained, high-cost coastal metros like New York, Miami, coastal Connecticut, and California, the answer is density: apartment towers, mid-rise buildings, anything that fits on an expensive lot. In the Southeast and South Central metros, the answer is sprawl: detached single-family homes on land that is still available and affordable enough to support that model.
Neither approach is inherently superior, but they produce very different outcomes for residents seeking homes and for the long-term sustainability of growth. The metros building the densest are largely doing so out of necessity; the metros building the most single-family homes are doing so because market conditions still allow it.
Top 10 U.S. Metro Areas by Share of Residential Permits for Single-Family Homes, 2025
Rank | Metro | Share of 2025 permits for single-unit housing |
|---|---|---|
1 | Spartanburg, SC | 100% |
2 | Stockton-Lodi, CA | 100% |
3 | Lafayette, LA | 100% |
4 | Myrtle Beach-Conway-North Myrtle Beach, SC | 99% |
5 | Pensacola-Ferry Pass-Brent, FL | 98% |
6 | Youngstown-Warren, OH | 96% |
7 | Rockford, IL | 96% |
8 | Columbus, GA-AL | 94% |
9 | Memphis, TN-MS-AR | 93% |
10 | Winston-Salem, NC | 93% |
The multi-unit table has an interesting wrinkle: Syracuse and Santa Maria appear in both the biggest YOY gains table and the densest-building table. Their permit surges are primarily apartment- and multifamily-driven, which explains both the scale of the percentage jump and the density share. That pattern, a small metro absorbing a concentrated wave of multifamily development, is increasingly common in markets where land costs and state policy are beginning to push density into places that have historically built only single-family homes.
On the other end, the single-family dominance list is a roster of smaller Southern metros and a few Midwest cities where detached housing remains essentially the only product being built. Spartanburg, Lafayette, and Myrtle Beach are issuing virtually 100 percent of their permits for single-unit homes, reflecting both builder preference and the continued availability of developable land at prices that make sprawl economically viable.
Methodology
This analysis is based on residential building permit data from the U.S. Census Bureau's Building Permits Survey, covering the 150 largest U.S. metropolitan areas.
To understand whether housing construction is keeping up with population growth, we looked beyond year-to-year changes and instead compared cumulative trends. Specifically, we measured the total number of housing permits issued between 2021 and 2024 against population growth over the same period.
Because permits represent homes that are approved — but not yet completed — they provide an early, consistent signal of where new housing supply is likely to emerge. To make that comparison meaningful, we estimated how many people those permitted homes could accommodate using standard assumptions about household size, and then compared that figure to the number of new residents added in each metro.
From that, we calculated a supply ratio for each metro: the estimated number of people that new housing could support divided by total population growth from 2021 to 2024. This allows us to approximate whether housing production has kept pace with demand. Metros were then grouped into three categories: underbuilt (construction has not kept up with population growth), in balance (construction has roughly matched growth), and overbuilt (housing production has exceeded recent population growth).
We then extended the analysis into 2025 to estimate whether more recent permitting activity could begin to close any remaining gaps. For metros that fell short between 2021 and 2024, we calculated how much of that gap could theoretically be reduced by permits issued in 2025.
Limitations: This analysis focuses on permitted housing, not completed units, and actual delivery timelines can vary based on labor, materials, and financing conditions. Population growth is used as a proxy for housing demand, but does not capture changes in household formation, vacancy rates, or longer-term supply shortages. As a result, a metro identified as overbuilt in this analysis may still face affordability challenges or structural housing constraints not reflected in recent growth trends.