
With the country sharply divided, every vote in this year’s presidential election (and the primaries) will be crucial – yet many will never be cast. Millions of citizens failed to register or vote in the last two presidential contests, though each hinged on fewer than 80,000 ballots.
With such narrow margins for victory, we wanted to find out why and where Americans don’t show up to vote, let alone register. To do this, InMyArea’s data analysts dug into the Census Bureau’s latest voting and registration data from all 50 states and D.C.
Key Findings:
- 51% of unregistered Americans simply lack interest in voting. If they decided to vote, as many as 37 million more votes could be cast. This attitude was more likely among people in Wisconsin and Maine.
- Gen Z adults were more likely to miss registration deadlines than older Americans. In fact, 8% of non-registered Gen Zers said they didn’t know how or where to register.
- Illness or disability stopped nearly 15% of registered voters from voting in the 2022 midterms. This was also the top reason registered voters didn’t cast a ballot in New Mexico.
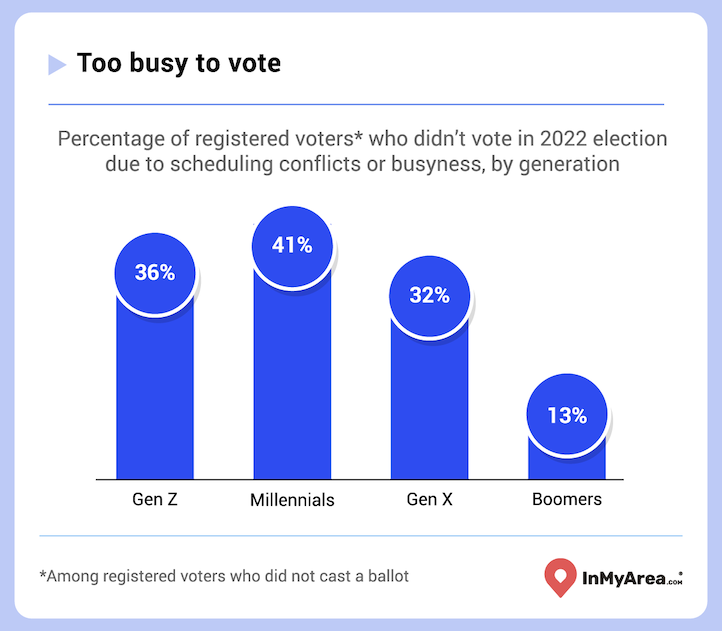
- Nationwide, around 31% of registered voters who missed the 2022 midterms said they were too busy. This was even more of an issue in Idaho, Nebraska, and Iowa.
- Nearly 1 in 10 registered voters who didn’t cast a ballot said they simply forgot to vote in the 2022 election, and registered voters in Washington and Montana were the most absent-minded: more than 20% in each state simply forgot to cast or mail their ballots.
Why Don’t More Americans Register To Vote?
The first step toward participating in any election is registering to vote, which is required in every state except North Dakota. Though laws and requirements vary by state, several nationwide initiatives have simplified voter registration over the last three decades. Today, 24 states have Automatic Voter Registration (AVR) measures that place citizens on the voting rolls by default. Forty-two states also offer online voter registration.

Despite the advancement of measures designed to ease the registration process, there remains significant room for growth in the voting roles before November. Nearly half of unregistered adults wanted to vote in the midterm elections, but rules, confusion, or personal circumstances stopped them from following through. However, most unregistered adults willfully sat out the 2022 election process.
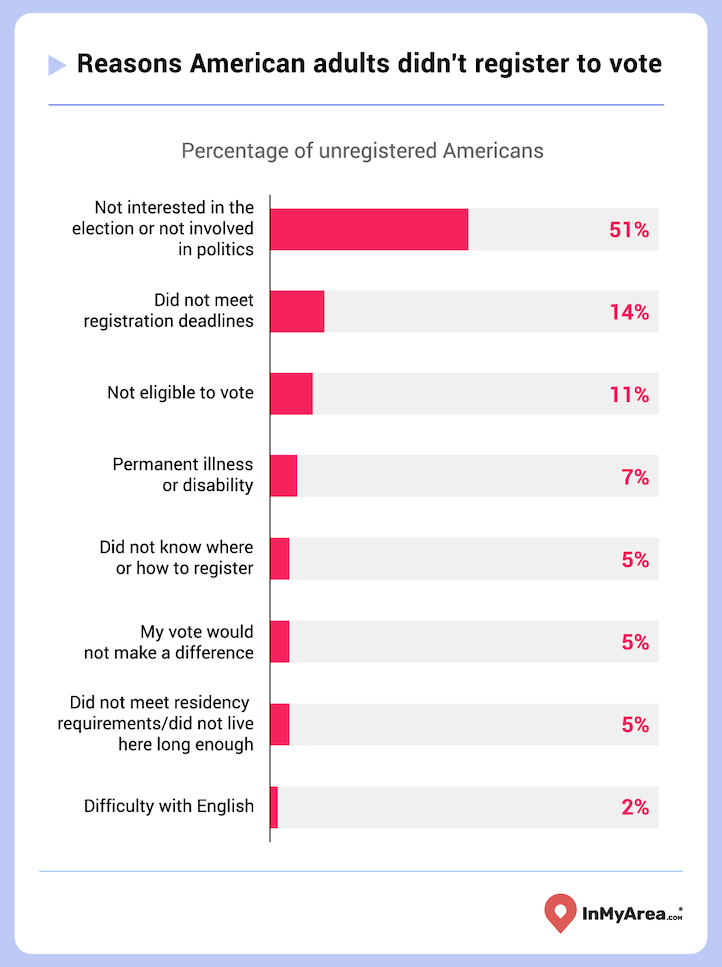
Fifty-one percent of non-registered adults said they weren’t interested in politics or the midterm contest. Over three-quarters of unregistered residents in Maine and Wisconsin cited disinterest as their reason for non-participation. An additional five percent (or 3.6 million people) didn’t believe their vote would have any impact, a rate that soared to 12 percent in Montana. Such collective indifference may only deepen this cycle, with many Americans disappointed in the presidential rematch, believing both candidates are too old for the office.
One in seven unregistered Americans – constituting more than 10 million potential ballots – failed to register for the 2022 midterm because they had missed registration deadlines. Most states require registration to be completed two to four weeks before an election. However, 22 states permit same-day registration, allowing citizens to register and vote simultaneously.
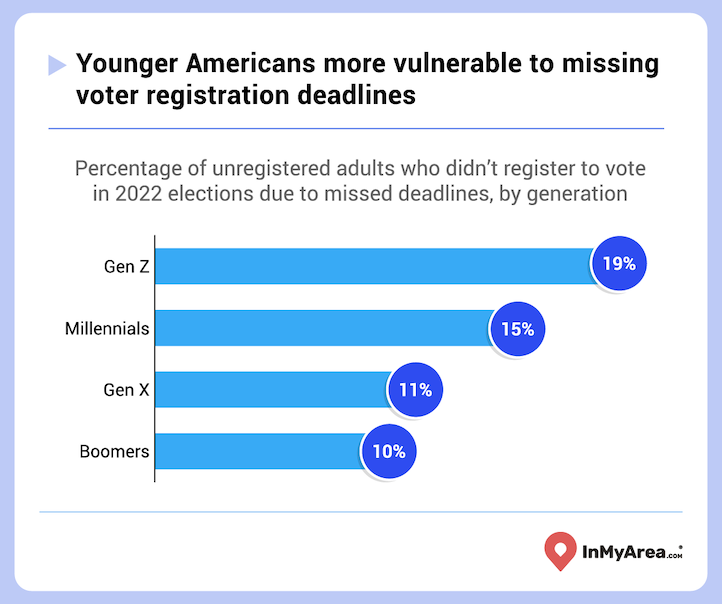
Missed registration deadlines most impacted the youngest potential voters. This may be due to the irresponsibility of youth, but cut-offs are also more likely to frustrate first-time voters than those relying on previous enrollment. One-fifth of unregistered Gen Z adults blamed missed cutoff dates for their exclusion from the voter rolls, double the percentage of Boomers. Additionally, eight percent of those in Gen Z were unregistered simply because they didn't know where or how to enroll.
Eleven percent of unregistered adults couldn't register due to ineligibility. They're primarily non-citizens and convicted felons. Most states don't allow felons to vote, except Maine and Vermont. Some reinstate voting rights with certain conditions, while others revoke them indefinitely. About5 million Americans can't vote due to felony convictions.
Why People Don’t Register to Vote in Each State
In 26 states, missed registration deadlines were the primary reason adults interested in voting remained unregistered – including more than one-quarter of those unregistered in Florida (27 percent) and Rhode Island (26 percent). Eight of those states offer election day on-site registration, indicating that many were unaware of the option or would only vote by mail. Additionally, numerous states are purging voter rolls ostensibly in the name of election integrity – removing eligible, registered citizens without notification and leaving them unknowingly unregistered.
To learn how impactful each obstacle was in your state, consult the interactive map below – use the dropdown menu to see the national distribution of each registration impediment.
In 13 states, ineligibility was the primary registration barrier among interested adults. Five of these states were in the upper Midwest, including Illinois, where 20 percent of unregistered people were ineligible to vote (tied for the highest percentage with Georgia).
Permanent illness or disability (their own or a family member’s) hampered 21 percent of adults who didn’t register to vote in Michigan. Confusion about where and how to register most affected the voting rolls in North Dakota (14 percent didn’t overcome the challenge).
Interestingly, there were regional trends in registration rates: they ranged from a high of 77 percent in Oregon (which pioneered AVR programs) to a low of 56 percent in North Carolina.
States with the best and worst voter registration rates
States with highest registration rates |
Percentage of voting-age population registered |
States with lowest registration rates |
Percentage of voting-age population registered |
|---|---|---|---|
Oregon | 77% | Florida | 56% |
District of Columbia | 77% | North Carolina | 56% |
Michigan | 75% | Texas | 56% |
Missouri | 75% | California | 57% |
Vermont | 75% | New York | 58% |
Source: U.S. Census Bureau, Current Population Survey, November 2022 (Table 4a)
Notably, non-citizens comprise over 11 percent of the population in Florida, Texas, California, and New York (all are among the five states with the highest portion of non-citizen residents). This would have an impact on those states’ registration rates.
Why Aren’t Registered Voters Casting Ballots?
Registering to vote is only the first step in making one’s voice heard. Casting a ballot is the critical part and entails additional hurdles. Inconvenience, indifference, personal issues, and logistical problems kept one-quarter of registered voters from participating in the 2022 election.
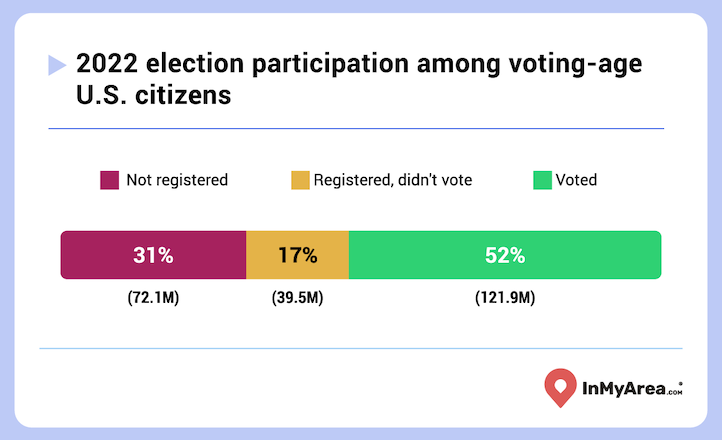
Overall, a bare majority (52%) of America's voting-aged population voted during the last midterms. Though that turnout marked the second-best showing for a non-presidential election this century, nearly 40 million registered voters failed to cast ballots, and over 100 million adult citizens were omitted from the process.
Though broader participation is expected this November than in 2022, it’s helpful to evaluate the reasons Americans stayed home in the last midterm election.
For all states except four, the top reason registered people didn’t vote in 2022 was because they were too busy with work or school. In Oregon, Pennsylvania, and Rhode Island, however, the main reason was that they felt their vote wouldn’t make a difference. Unfortunately, In New Mexico, the top reason registered voters didn’t head to the polls was due to family or personal illness/disability.
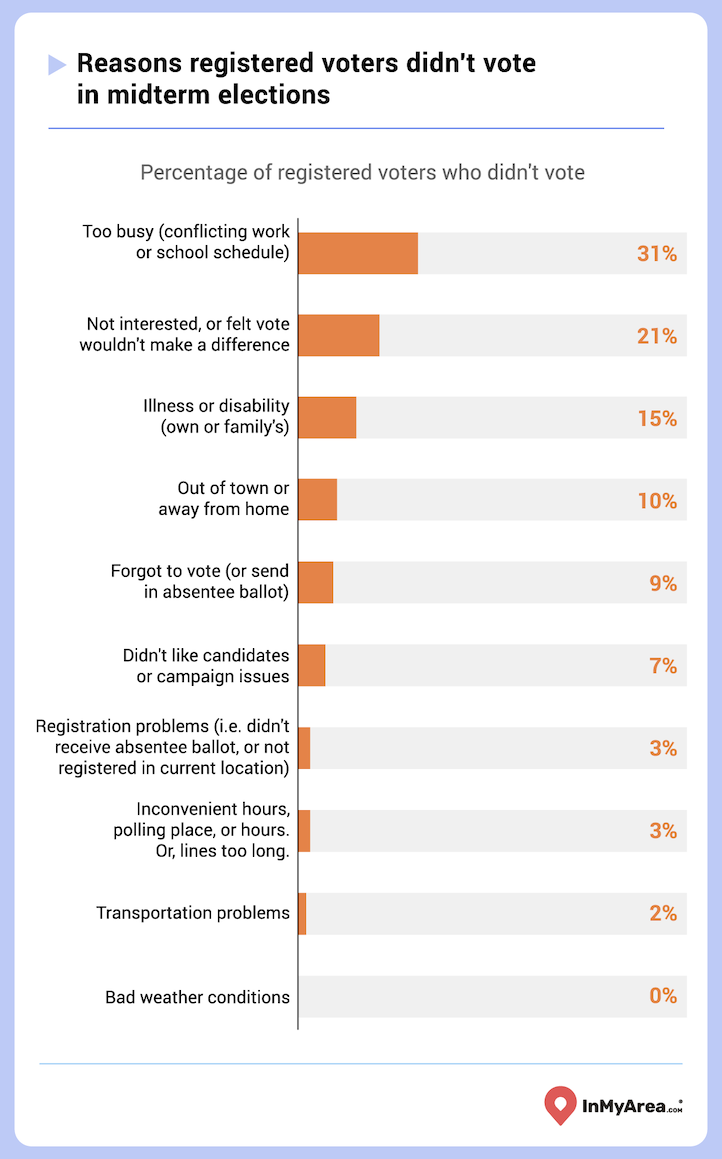
One-third of registered Americans didn’t vote in 2022 due to burdensome processes. Thirty-one percent cited conflicts with work or school schedules. This affected Millennials three times more than Boomers and was most prevalent in Idaho, where 43 percent of non-voting registered citizens blamed scheduling issues.
Another three percent cited inconvenient polling hours or long waits. That rate jumped to seven percent among Mississippians. Advocates, including President Biden, propose making election day a federal holiday to address scheduling conflicts. States should reverse the trend of closing polling places, hire more poll workers, and extend hours to enhance efficiency and accessibility.
Over one-quarter (27 percent) of registered citizens didn’t vote in 2022 due to disinterest, perceived lack of impact, or dissatisfaction with candidates and issues. In Oregon, 39 percent of non-voting registrants skipped the election because of disinterest. A dislike for 2022’s candidates and issues particularly affected the turnout in Nevada and Wisconsin, keeping 15 percent of registered voters from bothering with a ballot.
Many feel disillusioned with the two-party system, seeing it as favoring special interests and leading to partisan gridlock. The winner-take-all electoral college exacerbates feelings of futility, especially in non-swing states. Turnout was slightly higher in battleground states compared to blowout states in 2022.
Nearly 40 percent of registered voters nationwide failed to cast 2022 ballots due to personal or logistical problems. Personal issues included illness or disability, out-of-state travel, and forgetfulness. These obstacles were most likely to impact voters in New Hampshire, Alaska, and Washington, respectively.
Practical complications encompassed ballot complications (an impediment to 11 percent of non-voters in South Dakota), transportation problems (which hindered seven percent of Minnesotans), and bad weather (affecting four percent of the registered citizens of Montana who didn’t vote).
When voting is restricted to select locations within a limited time frame, unexpected life events will inevitably cause conflict. Women’s votes were particularly affected by health issues: 18 percent missed casting a ballot due to a medical condition or family illness, compared to only 11 percent of men.
To counter limited voting opportunities, offering more time and methods for ballot submission is crucial. During the pandemic, states expanded early polling and mail-in voting for the 2020 election, resulting in record turnout. Over two-thirds of voters utilized these options, marking a 60 percent increase in non-traditional voting compared to 2016. However, new restrictions imposed by legislators aim to enforce in-person, one-day balloting, driven by political motives and concerns about election integrity.
States with highest turnout rates |
Percentage of registered voters who voted |
States with lowest turnout rates |
Percentage of registered voters voted |
|---|---|---|---|
Colorado | 85% | West Virginia | 61% |
Oregon | 85% | Indiana | 63% |
Maine | 84% | Mississippi | 64% |
Wisconsin | 84% | Tennessee | 66% |
Pennsylvania | 83% | Alabama | 68% |
Source: U.S. Census Bureau, Current Population Survey, November 2022 (Table 4a)
On a more positive note, 76 percent of registered voters nationwide voted in the 2022 election. Turnout varied widely across different parts of the country – from a high of 85 percent in Colorado to a low of 61 percent in West Virginia.
Conclusion
The U.S., a nation founded on democratic values, faces declining voter turnout and ranks poorly among OECD nations for voting participation. Obstacles to registration, disillusionment in politics, and attacks on voting rights contribute to this decline.
Reforms like Electoral College overhaul, creating an election day holiday, and instituting compulsory voting may be needed, along with adopting pandemic-driven expansions of non-traditional voting. Technology like blockchain security and biometric authentication for smartphone app voting could revolutionize the democratic process in the future.
For now, it’s important for each of us to show up and vote, whether by mail or For information on local voting registration requirements and to register to vote, visit USA.gov today.
Our Data
Information contained in this report was from the Census Bureau’s Current Population Surveys’ voting and registration data tables. Voting and registration questions regarding the 2022 midterm elections were posed to all survey participants who were voting-age U.S. citizens. Voting and registration data are collected every two years to monitor trends in U.S. citizens' voting and nonvoting behavior in terms of their different demographic and economic characteristics.